Live balance, now with weekly snapshots.
Every Monday a new export appears — a frozen snapshot of where every container stood at the start of the week.
What changed
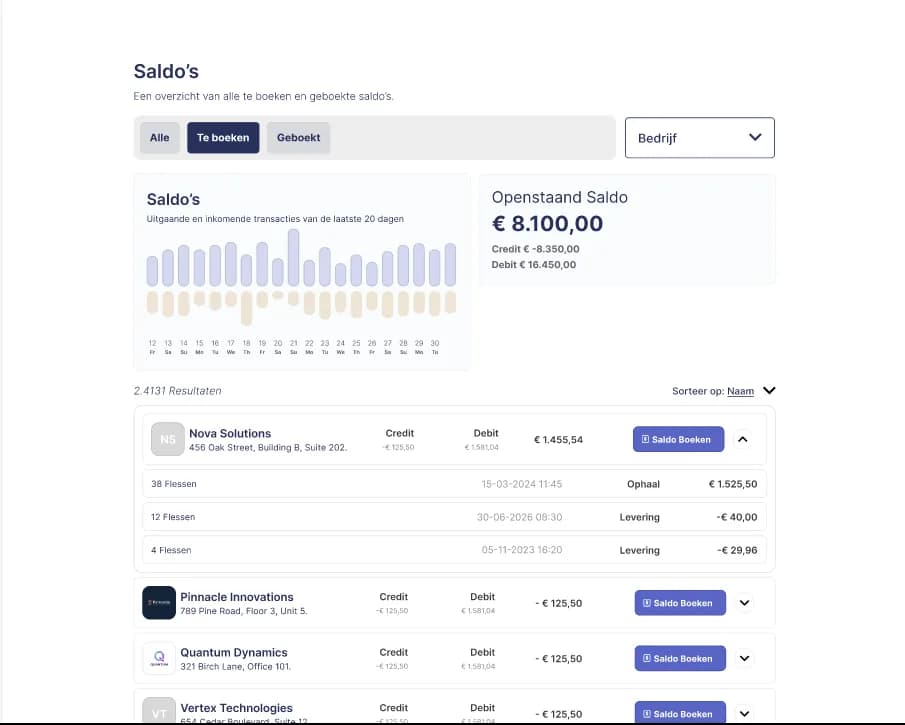
Until now the Ecolup dashboard showed the live balance per customer: a real-time counter that moved with every delivery and pickup. That stays.
But for month-end closings, audits and internal reports, customers needed something else: a snapshot. A fixed picture of how the distribution looked at a specific moment.
From now on Ecolup automatically generates such a snapshot every Monday — an overview of all customers, container types and quantities as they stood at the start of the working week.
What you can do with it
- Compare week over week: is the balance drifting or staying stable?
- Use the export at month-end closings as a neutral reference point
- Share the overview internally or with customers who want more transparency
Available for all customers
The weekly snapshots are available for all active Ecolup customers, with no extra configuration. You can find the exports under Dashboard → Reports → Weekly snapshots.
Not a customer yet? Schedule a 30-minute introduction and see the dashboard live in action.